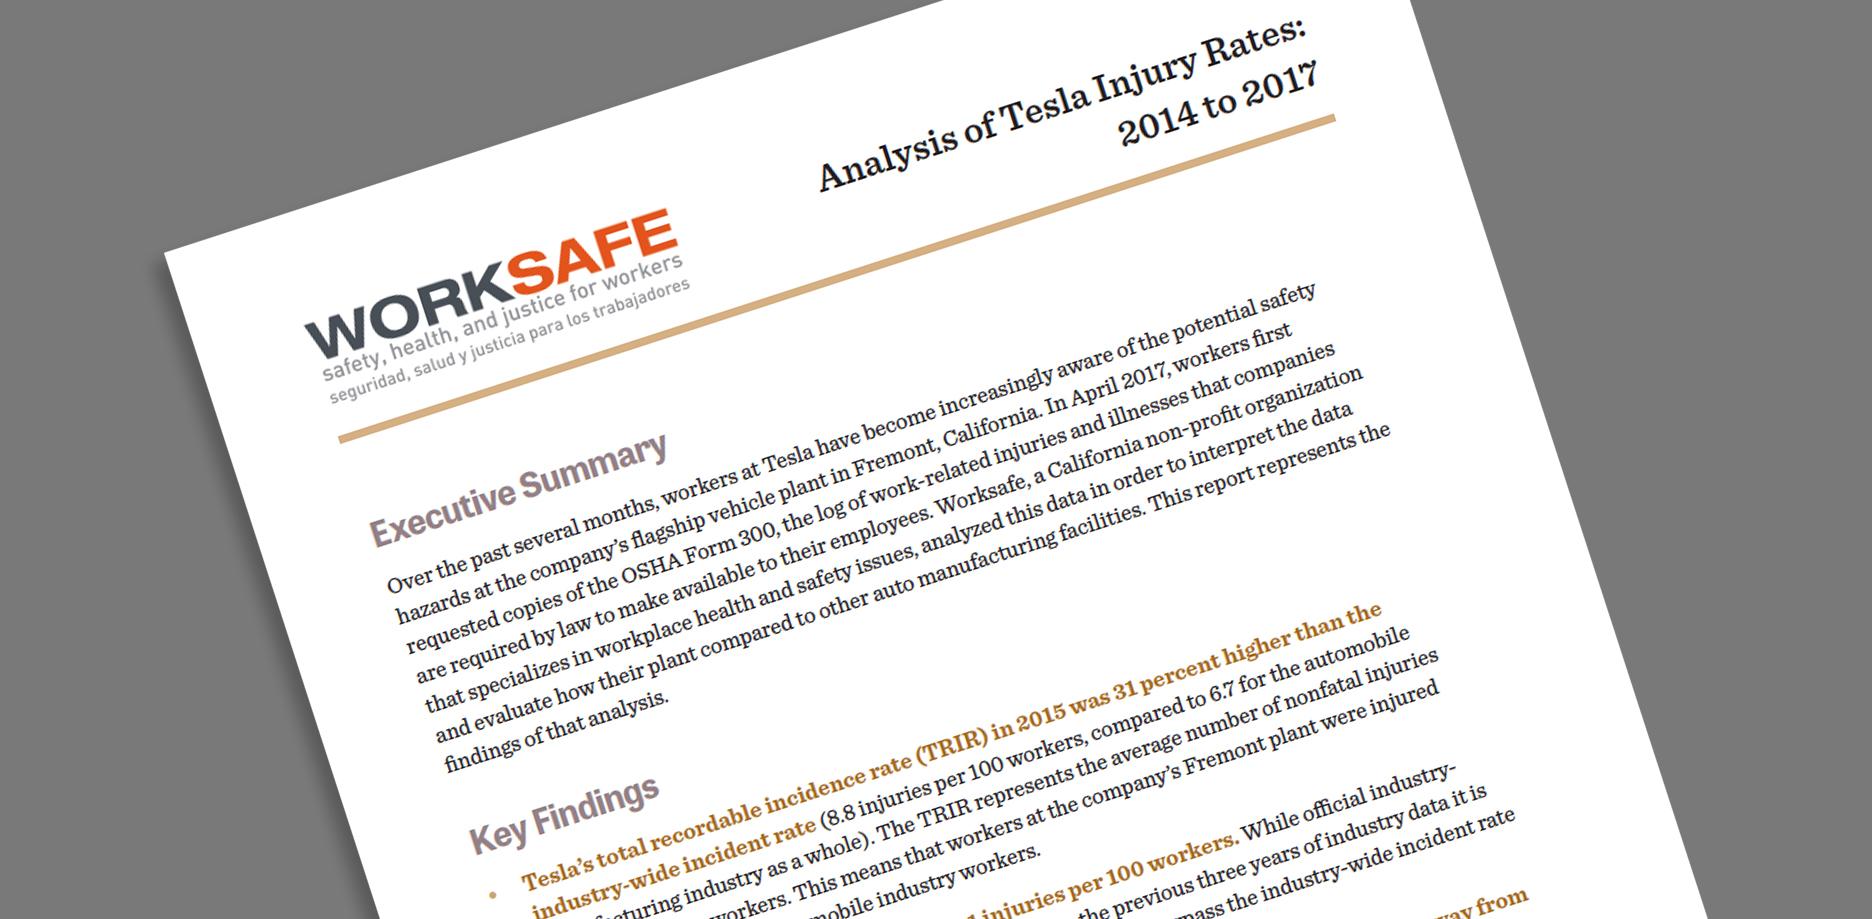
A report released today by Worksafe, a California nonprofit that advocates for better health and safety protections for workers, shows that Tesla’s own internal data demonstrates annual injury rates at its Fremont plant have consistently exceeded industry averages. For example, in 2015—the last year for which industry-wide comparative data is available—Tesla’s overall injury rate in Fremont has been about one-third higher than the industry norm, and its serious injury rate (those involving job transfers or missed days) is well over double the average.
See initial coverage of the report on CBS, here.
Worksafe’s findings come as Tesla management has stepped up its efforts to defend its safety record. In recent public statements, Tesla has compared its injury rates for the first quarter of 2017 to the same period last year, and sought to make the argument that “since January 1st, our total recordable incident rate (TRIR) is under 3.3, which is less than half the industry average of 6.7.” But the Worksafe report calls into question whether such comparisons are valid, noting, for example, that as late as May 2017 Tesla was still making major updates to the data it had provided Cal/OSHA for the 2016 calendar year.
This detailed analysis is based on data from Tesla’s annual injury logs—known as the OSHA Form 300—that companies are required by law to maintain.
“Employees have the right to get copies of a company’s injury reporting records so they can understand the potential hazards at their workplace, and that’s just what workers at Tesla chose to do,” said Doug Parker, Executive Director of Worksafe. “We analyzed their records and compare them to the automobile assembly industry as a whole.”
The report also delves into two of the hundreds of cases reported on the OSHA logs to reveal the human stories behind the short descriptions contained in the company data.
Among the key findings in the report:
- Tesla’s total recordable incidence rate (TRIR) in 2015 was 31 percent higher than the industry average (8.8 injuries per 100 workers, compared to 6.7 for the automobile manufacturing industry as a whole). The TRIR represents the average number of nonfatal injuries per 100 full-time workers. This means that workers at the company’s Fremont plant were injured more than the average automobile industry worker.
- Tesla’s total injury rate for 2016 was 8.1 injuries per 100 workers. While official industry-wide statistics are not yet available for 2016, based on the previous three years of industry data it is very reasonable to expect that the company’s rates will again surpass the industry average, which has stayed relatively constant over time.
- The rate of serious injuries at Tesla’s Fremont plant—those that result in days away from work, restricted duty, or job transfer—was approximately double the industry average for 2015. This measurement is known as the DART rate. The DART rate at Tesla in 2015 was 7.9 compared to the industry average of 3.9. Tesla’s DART rate for 2016 was 7.3, which based on the previous eight years of industry data, it is reasonable to expect will again be higher than the industry average.
You can view a full copy of the report here.

